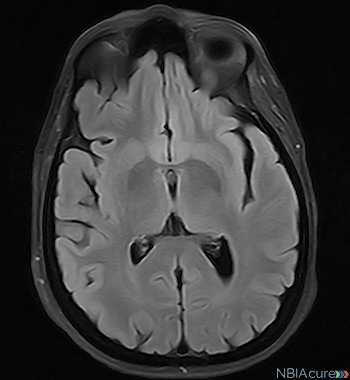
 What is an MRI?
MRI stands for magnetic resonance imaging. An MRI produces a picture of the body that is created using a magnetic field and a computer. The technology used in an MRI is different from that of an x-ray. An MRI is painless and is even considered safe to do during pregnancy. Sometimes an MRI is done of the whole body, but more often, a doctor will order an MRI of one particular part of the body.
The image on the left shows a T2 MRI of a normal brain. In this type of MRI, the bright areas indicate pockets of fluid and the dark areas indicate iron accumalation.
The use of an MRI for NBIA diagnosis
Evidence of iron accumulation on a brain MRI raises immediate suspicion of NBIA. Some NBIA subtypes have specific features that can be seen on an MRI and set them apart from other similar disorders. A gradient echo (T2) sequence is the preferred type of MRI for NBIA diagnosis because it is highly sensitive to the detection of brain iron.
NBIA disorders lead to a (typically symmetrical) distribution of iron in parts of the gray matter that are normally rich in iron content, such as the globus pallidus, substantia nigra, red nucleus, dentate nucleus, putamen, and thalamus. These parts of the brain can be seen in the images below.
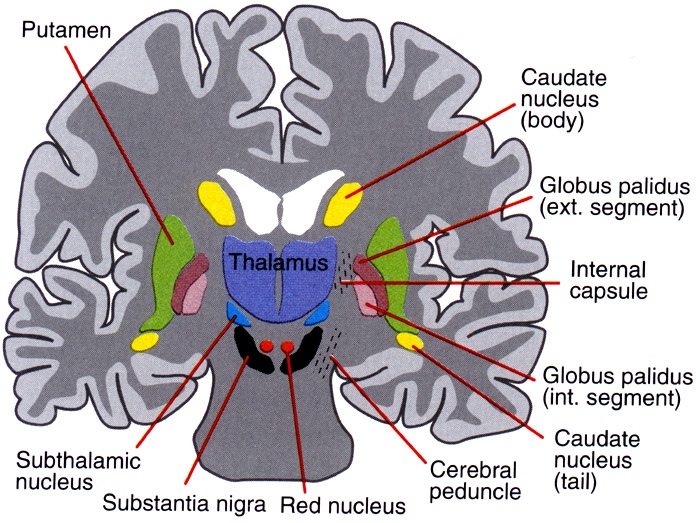
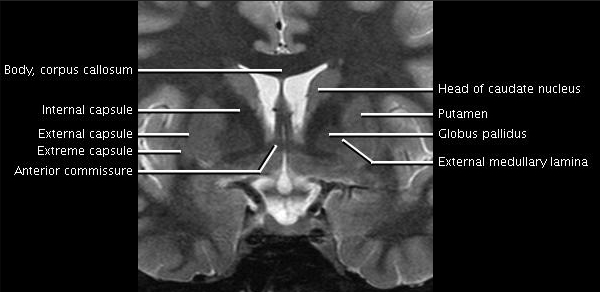
Each subtype of NBIA has characteristic features seen on an MRI that help distinguish it from the other subtypes. Below is a chart summarizing those features:
| NBIA Subtype | Brain Areas with Iron Accumulation | Other Key MRI Features |
|---|---|---|
| PKAN | – Globus pallidus – Substantia nigra |
– Eye-of-the-tiger sign in globus pallidus |
| PLAN | – Globus pallidus (patchy) – Substantia nigra – Some cases have no iron accumulation |
– Cerebellar atrophy |
| MPAN | – Globus pallidus – Substantia nigra |
– Hyperintense (bright) streaking of the medial medullary lamina between the globus pallidus interna and externa on T2 MRI – Cerebellar atrophy – Cortical atrophy |
| BPAN | – Globus pallidus – Substantia nigra |
– The substantia nigra has a thin, dark central band (hypointensity) surrounded by a “halo” of brightness (hyperintensity) on T1 MRI – More iron accumulation in the substantia nigra than the globus pallidus – Mild cerebellar atrophy |
| FAHN | – Globus pallidus – Substantia nigra |
– Confluent white matter hyperintensity (brightness) on T2 MRI – Pontocerebellar atrophy |
| Kufor-Rakeb syndrome | – Globus pallidus (patchy) – Putamen – Caudate – Some cases have no iron accumulation |
– Cerebral atrophy – Cerebellar atrophy – Brain stem atrophy |
| Neuroferritinopathy | – Globus pallidus – Putamen – Caudate – Dentate – Thalamus |
– Cystic cavitation – Mild cortical atrophy – Mild cerebellar atrophy |
| Aceruloplasminemia | – Globus pallidus – Putamen – Caudate – Dentate – Thalamus – Red nucleus |
– Confluent white matter hyperintensity (brightness) on T2 MRI – Cerebellar atrophy |
| Woodhouse-Sakati syndrome | – Globus pallidus | – Confluent white matter hyperintensity (brightness) on T2 MRI – Cerebellar atrophy |
| CoPAN | – Globus pallidus – Substantia nigra |
– Hyperintense caudate, putamina, medial and posterior thalami in early disease on T2 MRI – Globus pallidus calcifications |
PKAN
In both the classic and atypical forms of PKAN, an “eye-of-the-tiger” sign is almost always seen on a brain MRI.
- Most individuals with PANK2 gene changes have the “eye-of-the-tiger” MRI sign
- Almost all individuals with the “eye-of-the-tiger” sign have at least one PANK2 gene change
- Brain MRI has also accurately predicted PKAN in pre-symptomatic siblings of affected individuals
PKAN “Eye-of-the-Tiger” MRI Sign
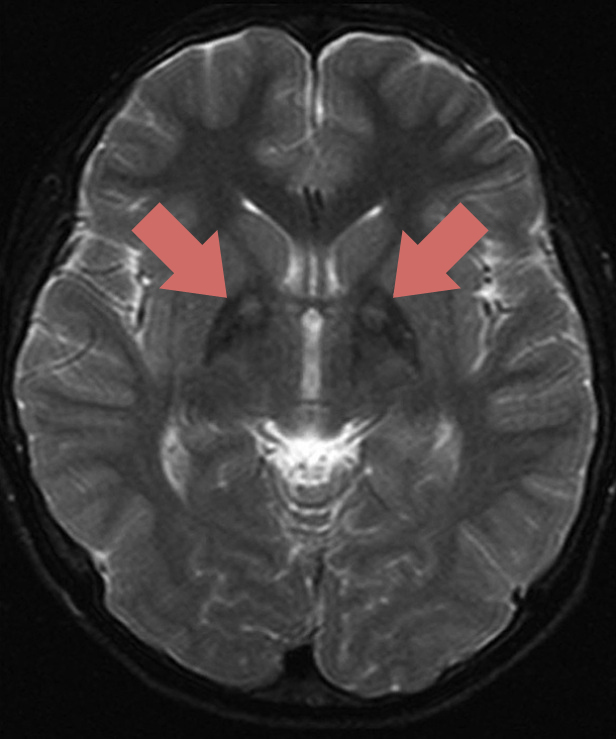 The image on the left shows a T2 MRI with an “eye-of-the-tiger” sign. On a T2 MRI, the bright areas indicate pockets of swelling and fluid and the dark areas show iron accumulation. In the majority of PKAN cases, iron accumulation is only found in the globus pallidus and substantia nigra regions of the brain, which help control movement.
An “eye-of-the-tiger” sign is defined as an area of central hyperintensity (bright) surrounded by hypointensity (dark) in the globus pallidus region of the brain.
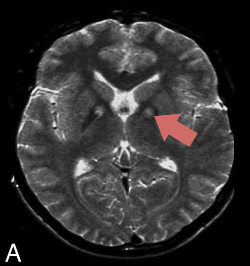
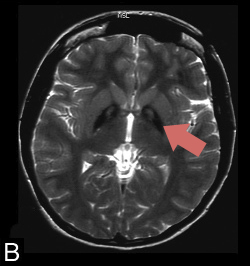
The bright areas seen in image A are usually large in the first stages of PKAN and represent early damage and fluid accumulation in the tissue. As the disease progresses, the bright spots tend to shrink and the darker areas of iron accumulation become larger and more noticeable, as seen in image B. The combination of a dark region with a bright center creates an “eye of the tiger” sign.
PLAN
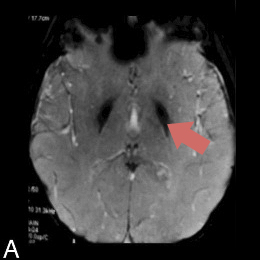
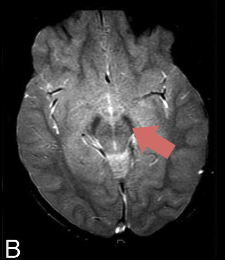
In PLAN cases, iron accumulation (dark patches) can be seen in the globus pallidus (image A) and the substantia nigra (image B) on T2 MRI. However, only some cases have iron accumulation and it may develop late in the disease course, or it may only be associated with more severe PLAN gene changes.
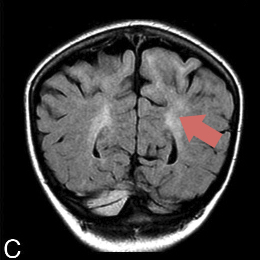
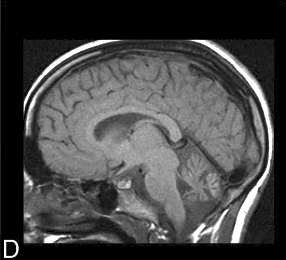
In addition, some confluent hyperintensities (white patches that run together) in the white matter may be observed (image C). Cerebellar atrophy is commonly seen in individuals with PLAN. As seen in image D, this refers to a decrease in the total size of the cerebellum. Typically, the atrophy can be seen on MRI before the iron accumulation.
MPAN
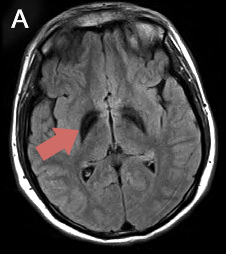
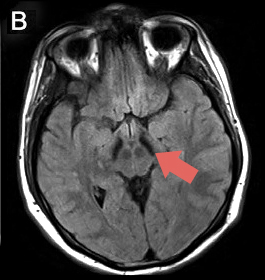
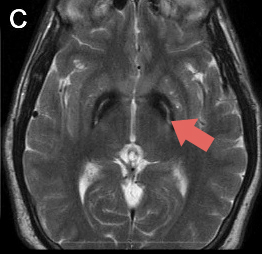
In MPAN cases, iron accumulation (dark patches) can be seen in the globus pallidus (image A) and the substantia nigra (image B) on T2 MRI. Image C shows hyperintense (bright) streaking of the medial medullary lamina (which divides the globus pallidus into its “internal” and “external” halves). This bright streak in the middle of a dark patch of iron accumulation can be mistaken for an “eye-of-the-tiger” sign but is different on closer inspection. Some individuals also have cerebellar atrophy and/or cortical atrophy. This refers to a decrease in the total size of the cerebellum and/or cerebral cortex.
BPAN
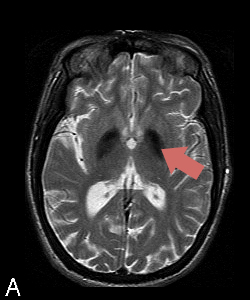
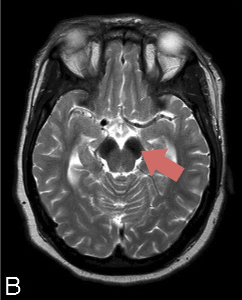
In BPAN cases, iron accumulation (dark patches) can be seen in the globus pallidus (image A), the substantia nigra and the cerebral peduncles (image B) on T2 MRI. As seen on the images, there is more iron accumulation in the substantia nigra and cerebral peduncles than the globus pallidus.
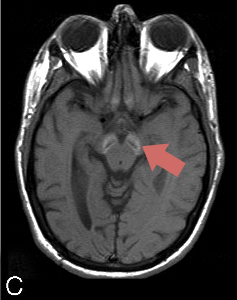
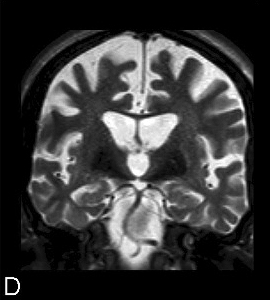
Image C shows hyperintensity (brightness) of the substantia nigra and cerebral peduncles with a central band of hypointensity (darkness) on a T1 MRI. Mild cerebral atrophy is also commonly seen in individuals with BPAN. As seen in image D, this refers to a decrease in the total size of the brain.
FAHN
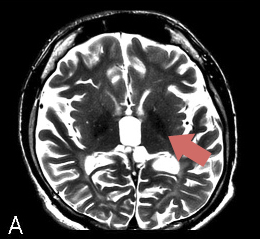
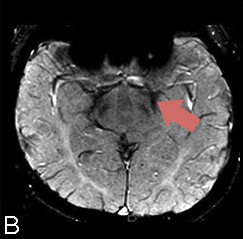
In FAHN cases, iron accumulation (dark patches) can be seen in the globus pallidus (image A) and the substantia nigra (image B) on T2 MRI. Typically, there is more iron accumulation in the globus pallidus.
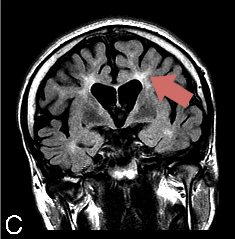
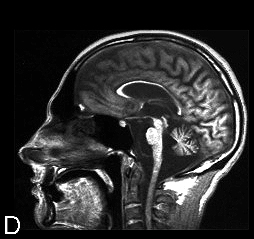
In addition, some confluent hyperintensities (white patches that run together) in the white matter may be observed (image C). Cerebral and pontocerebellar atrophy, along with thinning of the corpus callosum, is also commonly seen in individuals with FAHN. As seen in image D, this refers to a decrease in the total size of the cerebellum and brain stem. Atrophy can increase with time and may be profound.
Kufor-Rakeb syndrome
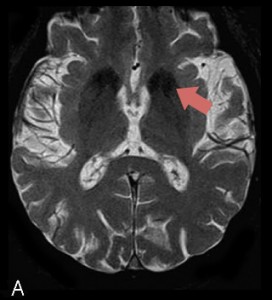
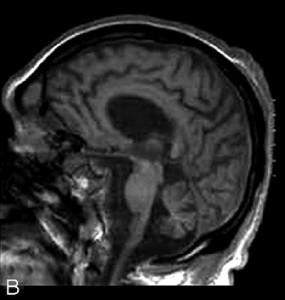
In individuals with Kufor-Rakeb syndrome, iron accumulation (dark patches) can be seen in the globus pallidus, caudate, and putamen (image A) on T2 MRI. However, only a portion of cases may have iron accumulation, it may develop late in the disease course, or it may only be associated with more severe Kufor-Rakeb syndrome gene changes. Generalized cerebral and cerebellar atrophy is also commonly seen in individuals with BPAN. As seen in image B, this refers to a decrease in the total size of the cerebellum and the brain in general. There may also be progressive atrophy of the pyramids resulting in a decrease in the total size of the brain stem.
Neuroferritinopathy
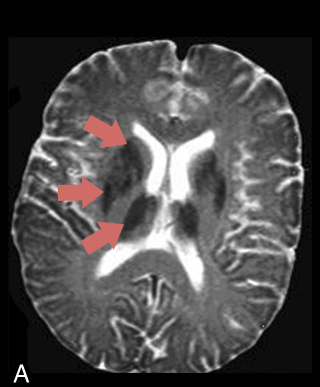
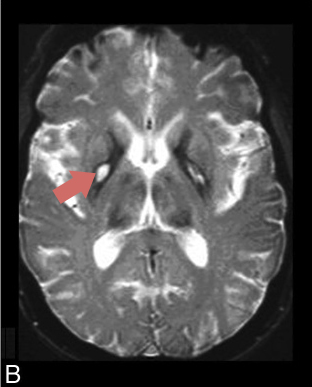
In individuals with neuroferritinopathy, there may be some patches of iron accumulation (dark spots) seen in the globus pallidus, caudate, and putamen and thalamus (image A) on T2 MRI. In addition, over time cystic cavitation of the brain can develop. At first, hyperintense (dark) partches are seen in the globus pallidus and putamen on T1 MRI. Eventually, they evolve into cystic changes and cavitation in the caudate and putamen which can be seen as white patches. White patches (cavitation) within an area of hypointensity (darkness) can be seen on image B. Mild cerebral and cerebellar atrophy is also commonly seen and refers to a decrease in the total size of the cerebellum and the brain in general.
Aceruloplasminemia
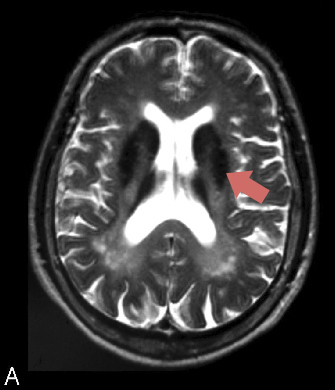
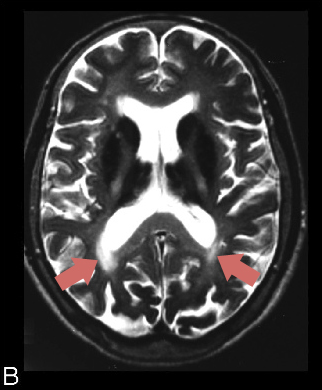
In aceruloplasminemia cases, iron accumulation (dark patches) can be seen in the globus pallidus, putamen, cudate, dentate, thalamus and red nucleus (image A) on T2 MRI. In addition, some confluent hyperintensity (white patches that run together) in the white matter may be observed (image B). An MRI of the abdomen would show hypointensity (darkness) indicating iron accumulation in the liver. Generally, iron content is greater in the liver than in the brain Cerebellar atrophy is also commonly seen in individuals with aceruloplasminemia and refers to a decrease in the total size of the cerebellum.
Woodhouse-Sakati syndrome
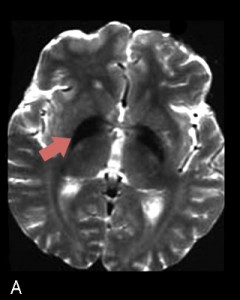
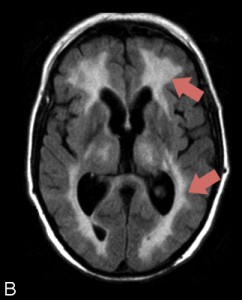
In individuals with Woodhouse-Sakati syndrome, iron accumulation (dark patches) can sometimes be seen in the globus pallidus (image A) on T2 MRI. However, the main feature seen is extensive confluent hyperintensities (white patches that run together) in the white matter (image B) on T2 MRI.
CoPAN
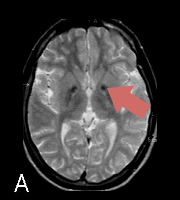
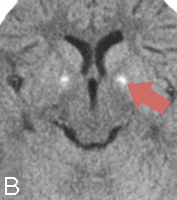
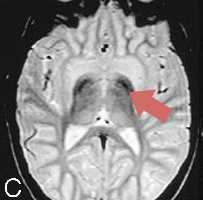
In CoPAN cases, iron accumulation (dark patches) with a central region of hyperintensity (brightness) can be seen in the globus pallidus (image A) on T2 MRI. The combination of a dark region with a bright center appears to create the “eye-of-the-tiger” sign seen in PKAN. However, additional testing using an axial CT shows that the bright areas are signs of calcification (as seen in image B). Image C shows hypointensity (darkness) in the pallida, while the caudate nuclei, putamina and thalamus are swollen and hyperintense (bright) on T2 MRI.
Copyright © 2014 by NBIAcure.org. All rights reserved.
MRI Images Credit
PKAN, PLAN, MPAN, BPAN, FAHN, Kufor-Rakeb syndrome images courtesy of Kruer et al. as published in Neuroimaging Features of Neurodegeneration with Brain Iron Accumulation (2012)
Neuroferritinopathy and Aceruloplasminemia images courtesy of P.F. Chinnery & H. Miyajima as published in Neuroimaging Features of Neurodegeneration with Brain Iron Accumulation (2012)
Woodhouse-Sakati syndrome images courtesy of S. Bohlega as published in Neuroimaging Features of Neurodegeneration with Brain Iron Accumulation (2012)
CoPAN images courtesy of Dusi et al. as published in Exome Sequence Reveals Mutations in CoA Synthase as a Cause of Neurodegeneration with Brain Iron Accumulation (2014)